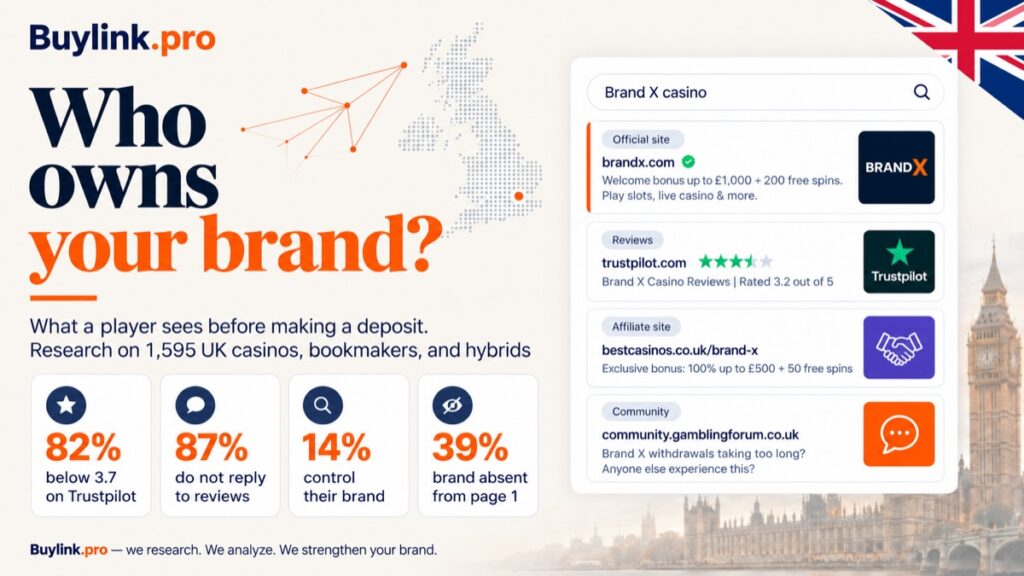
A player who has decided to try a brand does one thing before depositing: types its name into Google. We measured what they find there across the entire British category of casinos, bookmakers and hybrid operators: 2,904 UK brands scanned, 1,595 operators kept after classification, 1,409 studied in depth: branded search results, reviews, Reddit. Not a sample but a census of the category. Then we priced what a neglected brand page costs, in pounds. The data is British, but the mechanics are the same in any market where a player googles the brand before the first deposit.
A player googles the brand before depositing, and the first page for its name is held by review platforms and affiliates, not the brand itself: 39% of operators are not on it at all, and a good rating does not fix that. A Trustpilot rating depends not on the volume of complaints but on whether anyone answers them: silent brands sit at 1.94 with 62% negative reviews, brands answering nine reviews in ten at 3.12 and 44%. Reddit in this category is two-thirds noise; real negativity touches 0.5% of operators. For the median brand all of this costs £135,000 a year in affiliate tax for its own players and +18% on the price of every deposit from paid channels. The two strongest levers cost nothing but discipline.
- The first page has been surrendered by everyone. The brand holds one position in six, review platforms 30%, and 39% of operators are invisible under their own name. Rating does not help: brands rated 4.0+ control 12.3% of the page against 14.2% for everyone else. Section 3
- The leak comes out of your own acquisition budget. 79% of operators have an affiliate on their first page collecting CPA for players who typed the brand's name. For the median brand that is £11,250 a month. Section 7
- Answering reviews is the cheapest lever. 87% of operators have never answered a review: their rating is 1.94 with 62% negative. Those answering 90%+ hold 3.12 and 44%: a 1.2-star gap between two habits. A claimed profile by itself changes nothing. Section 4
- Reddit is smaller than the tools say. Keyword search finds 26% of operators; after the "thread is really about the brand" filter 8.7% remain, negative ones 0.5%. Section 5
- The category is young and thin. 41% of operators run on a domain younger than two years, 576 brands out of 1,595 have no reviews at all, and 11% of sites did not open during the scan. Section 2
The full five-step plan with effect and cost estimates: section 10.
of rated UK casinos, bookmakers and hybrids sit below 3.7 on Trustpilot, the zone where reviews start costing deposits
of operators have never answered a single review
of the first page for the brand name is controlled by the brand itself, on average
of operators do not appear on the first page for their own name at all
average-rating gap between those who answer reviews and those who never do
of operators have a third-party site squatting on the brand name on their branded first page
a year: affiliate tax for the median brand's own players
on the effective cost of a first deposit in paid channels because of the review page
Data collected 22 August - 7 September 2026. The whole category, no sampling. No brand is named in a negative context: aggregates only. Brands in the section "What good looks like" are named for strong, publicly verifiable results.
1. About the data: the whole category, no sampling
The whole category: 2,904 brands, 1,595 operators. Every UK brand in the Trustpilot gambling category: rating, number of reviews and whether the company has claimed the profile. Each brand was then classified by what it actually is, and this version keeps only casinos, bookmakers and hybrid operators: 1,595 brands. Set aside: 641 affiliates and comparison sites, 358 prize-draw operators, 171 parked or irrelevant sites, 82 aggregators, 47 lotteries and 10 casino-hire companies for events. 1,019 of the 1,595 have at least one review; 576 have none.
The deep scan: 1,409 operators. The whole category was studied in depth, not a sample of it. After merging brands trading on several domains (2,649) and removing 1,240 that are not casinos, bookmakers or hybrids, 1,409 operators remained. For each we recorded: the branded first page of Google UK (every result classified as the brand's own, a review platform, an affiliate, hostile or other), review health on Trustpilot (rating, negative share, reply share, dates), Reddit and Quora threads, domain registration date, site status, blog and promotions activity, business size and type.
Whom we call an operator. An operator in this report is a company that takes bets from the player directly: a casino brand, a bookmaker or a hybrid brand combining casino and betting. Not an affiliate, not a comparison site, not a bonus aggregator, not a prize-draw organiser. The distinction matters: affiliates and comparison sites carry ratings a point and a half higher and noticeably flatter any figure computed across the Trustpilot category as a whole. Every conclusion below applies only to those who hold the player's account.
Why no sampling. Selecting brands by rating, size or visibility inevitably skews the conclusions: a category studied through its problem brands looks worse than it is, and one studied through its large brands looks better. There is no selection here. The entire British category was scanned, so the shares in this report are market shares, not sample shares, and can be added up, compared across sections and plugged into your own calculations.
What was not measured. Traffic, revenue and conversion. The financial figures in section 7 are a model on stated assumptions, not measurements. Every assumption is listed so an operator can substitute their own numbers, and the calculator below does it for them.
Collection window: 22 August - 7 September 2026. Sources: public Trustpilot pages, branded Google UK results, Reddit and Quora, open domain registration data, company websites, the Gambling Commission register.
2. The category landscape: large, unhappy and a third without reviews
Even before the deep measurements, the category itself tells a clear story: gambling on British Trustpilot is large, mostly unhappy, and a third of it has no reviews at all. Of 1,595 operators, 576 (36%) have no reviews. Among the 1,019 that do, 81.8% sit below 3.7: the point after which a prospective player reads the review page as a warning rather than a confirmation. Only 6.9% reach 4.0 or higher, and 4.5 and above is nine brands in the whole country.
By business type
Within the group the three types sit close together, and hybrids, the largest brands with casino and betting at once, are rated lowest of all: more than four in five are below 3.7. For contrast: the prize-draw operators removed from this version average 4.37, affiliates and comparison sites 3.49. Any figure for the whole Trustpilot category is flattered by both.
| Type | Brands | Rated | Average rating | Below 3.7 | Profile claimed |
|---|---|---|---|---|---|
| Casino | 1,113 | 664 | 2.79 | 81.8% | 58.0% |
| Hybrid (casino + betting) | 374 | 290 | 2.63 | 84.1% | 65.2% |
| Bookmaker | 108 | 65 | 3.04 | 72.3% | 61.5% |
| set asidePrize draws | 358 | 322 | 4.37 | 10.2% | 86.6% |
| set asideLotteries | 47 | 37 | 3.22 | 56.8% | 67.6% |
| set asideAffiliates and comparison sites | 641 | 451 | 3.49 | 45.7% | 74.5% |
| set asideAggregators | 82 | 63 | 3.12 | 61.9% | 38.1% |
Scale helps, but not at first
Rating does not rise with review volume; it dips. Operators with 100-999 reviews have a median rating of 1.8, and 87% of them are below 3.7; even past 1,000 reviews the median only climbs to 3.3. The middle band is the brands that already have enough customers to receive complaints but not yet the operation to answer them.
| Reviews on the profile | Operators | Median rating | Below 3.7 | Profile claimed |
|---|---|---|---|---|
| fewer than 10 | 461 | 3.2 | 77.7% | 56.6% |
| 10-99 | 329 | 2.2 | 88.4% | 49.2% |
| 100-999 | 168 | 1.8 | 86.9% | 79.2% |
| 1,000+ | 61 | 3.3 | 63.9% | 95.1% |
The room is taken, but nobody is in it
Claiming a Trustpilot profile is free, takes minutes and unlocks the right to reply. 60.3% of rated UK operators have done it, and among those with more than a thousand reviews, 95.1%. So the door is open for almost everyone with something to lose.
Which makes the next fact far more awkward. A claimed profile by itself has no relationship with rating: 2.04 for claimed against 2.09 for unclaimed (deep-scan averages, see the note on the base in section 4). The owner badge changes nothing while nobody stands behind it, and, as section 4 shows, almost nobody does. The category has not lost access to its reputation. It was given access and did not use it.
3. Who owns the first page
We ran a branded query in Google UK for each of 1,391 operators and classified every first-page result. The question is simple: when a player searches for you, whose pages do they see?
The brand itself, counting its site, app-store pages and social profiles, holds one position in six (17% of all first-page positions; the average share for an individual operator is 14%, the median 10%). Review platforms hold 30%. Affiliates, earning commission on players the brand has already paid for, hold 6.3%. Another 2.0% of positions are hostile: negative pages or third-party sites squatting on the brand name.
39% of operators are absent from their own first page: not a single result of their own. Another 37% hold 1-20%. Only 2.2% control more than half, and just two operators in the whole category control more than 80%. Position #1 belongs to the brand in 9.1% of cases; in 59% of cases the brand is not even in the top three.
Rating does not buy the first page
It is natural to assume that brands players trust also look better in search. The data does not support it. The sixty-eight operators rated 4.0 and above hold position #1 in 8.8% of cases against 9.1% for the rest, and a page share of 12.3% against 14.2%. The difference is within noise, and its sign is the opposite of what you would expect: a good Trustpilot rating does not give a brand its own search results.
The only thing that visibly distinguishes the healthy group is third-party sites on the brand name: 89.7% have them against 98.6% of the rest. The conclusion is unpleasant but useful for an operator: search results are separate work. They cannot be obtained as a side effect of a good reputation on a review platform, and a brand rated 4.5 loses players on the first page exactly as a brand rated 2.0 does.
By size and business type
| Segment | Operators | Own share of the page | Brand at #1 |
|---|---|---|---|
| Micro | 1,047 | 13.2% | 8.9% |
| Small business | 218 | 18.1% | 10.6% |
| Enterprise | 114 | 14.0% | 8.8% |
| Casino | 967 | 15.1% | 10.3% |
| Hybrid (casino + betting) | 320 | 9.9% | 3.4% |
| Bookmaker | 104 | 17.6% | 14.4% |
Large brands are no better than micro-operators on page share: they attract more third-party coverage, and it crowds them out just as effectively. The divide runs by business type, not size. Bookmakers hold 17.6% of their page and stand at position #1 in 14.4% of cases; hybrids, the largest brands with casino and betting at once, hold 9.9% and take the top spot in only 3.4%. The more there is to write about a brand, the more of its first page belongs to someone else.
4. Reviews: rating follows the reply
The category's average rating is 2.07. This is not a sample of problem brands, it is the entire category, and it is the right place to ask: what separates a bad rating from a recovering one? The answer is not the volume of complaints. It is whether anyone answers them.
87% of operators have never answered a review. Their average rating is 1.94, and 62% of everything ever written about them is negative. The hundred operators answering 90%+ of reviews average 3.12 with a negative share of 44%. That is a gap of 1.2 stars between two habits, not two budgets. The base affects the size of the gap: the silent group includes profiles with nothing to answer yet, so the more reliable measure is the negative share, which the base does not distort: 62% against 44%.
A reply does not remove a bad review. It changes what the reader concludes: an unanswered one-star review reads as a pattern, an answered one as an incident. In a category where a third of the median profile's recent reviews are negative, that conclusion decides the deposit. How to reply so that it works is covered in a separate piece: a framework and templates for answering a negative review.
| Metric | All operators (n = 1,409) |
|---|---|
| Average Trustpilot rating | 2.07 |
| Profile claimed by the company | 57.2% |
| Negative reviews in the last 90 days, average share | 35.8% |
| Operators with 50%+ negative in 90 days | 38.6% |
| Operators that have never answered a review | 87.2% |
| Operators answering 90%+ of reviews | 8.0% |
| Operators with no new review in 30 days | 63.3% |
Note on the base. The ratings in this table and the chart above are averages across all deep-scan operators (n = 1,409, of which 1,253 with a known reply share), not only those with a Trustpilot rating. That is why 2.07 is lower than the type averages in section 2 (2.6-3.0), which are computed across the 1,019 rated operators: two different bases, not a contradiction in the data. The groups in this section are comparable with each other; to compare with a specific profile's rating, use the figures in section 2.
Claiming is not enough
Claiming a profile looks like an action but is not one. The average rating is 2.04 for those who claimed and 2.09 for those who did not: a difference within noise, with the sign the opposite of what you would expect. Claiming is not reputation work, only permission to do it: among claimed profiles the reply share is 14.8%, among unclaimed 0.2%. But even 14.8% is one reply for every seven reviews on average, so almost nobody uses the permission.
Frozen profiles
The recency of the last reply divides the category more sharply than any other measure. Operators that replied to anyone in the last 30 days average 3.03. Those that never replied, or not at any known time, and that is 1,249 operators out of 1,409, average 1.94. And 63% of operators received not a single review in the last 30 days: a quiet profile does not mean a clean one, it means a frozen one, and the last review speaks for it.
| Time since the last reply to a negative review | Operators | Average rating |
|---|---|---|
| 30 days or less | 86 | 3.03 |
| 31-90 days | 39 | 2.84 |
| 91-365 days | 35 | 2.86 |
| Never / unknown | 1,249 | 1.94 |
5. Communities: the Reddit myth
Community monitoring is sold on a scary number. We measured how much of it survives contact with the brand's name.
Keyword search reports that 26% of operators are discussed on Reddit. Require that the thread actually be about the brand, with its name in the thread's own URL, and the figure drops to 8.7%. Threads that are both relevant and negative exist for 0.5% of operators: five brands in a thousand.
The gap is not a tool error but a property of names in this category. Operators are named with words that are also ordinary words: "spin", "lucky", "mate", "win". A relationship-advice thread that happens to contain one of them is counted as a brand mention by any keyword monitor. The conclusion is not that Reddit does not matter. It is that two-thirds of the claimed "Reddit presence" is noise, and a brand paying for monitoring should first ask to see the threads themselves. Where Reddit really works for a brand and how presence is built there is covered in why choose Reddit for marketing.
Activity and domain age
41% of operators run on a domain registered less than two years ago; 33% on domains ten years old or older. Domain age correlates with both rating and control of search results. The youngest domains average 1.89, domains of 2-5 years 2.58, ten-year-old ones 2.20. Search control grows with age even more visibly: 8% for the youngest against 22% for five-to-ten-year-old domains. Young domains have not had time to earn either reviews or their own results in search; the oldest carry a decade of accumulated third-party coverage and, often, stale negativity.
Other activity markers: 55% of operators have a live promotions page, 10% run a blog (a third of those published in the last 90 days), and 11% of the category's sites did not open at all during the scan. The category has real churn.
Got a task around reputation, search or communities? Tell us about it on a short intro call and we will suggest where to start.
About 30 minutes. No obligations.
6. One main problem per brand
Each operator was assigned one dominant reputation pain based on the measured signals: search results, review profile or communities. This is diagnosis, not segmentation, and applied to all 1,409 operators it shows where the category's problem really lives.
For 67.5% of operators the main problem is search: what a player sees after typing the brand's name. Reviews are the main problem for 14.4%. Communities, after the relevance filter, for one operator out of 1,409. And 18.0% have no measurable reputation pain at all.
The cut by rating is the most useful part, and on the full category it became more convincing. Among the 68 brands rated 4.0+, 39 have search results as their main problem, and reviews did not become the main pain for a single one of them. Among brands below 4.0, search dominates for 68%, reviews for 15%. Read together: reviews are the pain of the already damaged; search results are everyone's pain, including brands that players like.
| Size | Search | Reviews | No pain | Communities |
|---|---|---|---|---|
| Micro (n = 1,059) | 777 | 82 | 199 | 1 |
| Small business (n = 221) | 121 | 70 | 30 | 0 |
| Enterprise (n = 117) | 47 | 46 | 24 | 0 |
| Medium (n = 11) | 5 | 5 | 1 | 0 |
Small business and enterprise are the sizes where reviews compete with search for the role of main pain: at enterprise level they are almost level, 47 against 46. Large operators generate a volume of reviews that micro-brands never see; the search problem, by contrast, does not distinguish size and presses on everyone equally.
7. What it costs: a model for the marketer
Nothing in this study measured deposits. But every operator knows three numbers: the cost of a first deposit, the terms of their affiliate deals and roughly how many players search for the brand by name. Put them next to the first-page and review figures above, and the price of a neglected brand page becomes a budget line rather than a feeling. The model below uses typical UK-market figures; the calculator at the end of the section will plug in yours.
Assumptions
| Input | Value | Why |
|---|---|---|
| Branded searches per month | 10,000 | A mid-sized UK brand; the model scales linearly |
| Click share by position | #1 28% · #2 15% · #3 11% · #4-#6 6% each · #7-#10 3% each | A typical first-page click curve |
| Branded-intent visitor to first deposit | 15% | A player searching by name is long past the discovery stage |
| Cost of a first deposit in paid channels | £250 | A typical range for UK online casinos is £150-£400 |
| Affiliate terms | £250 CPA or 30% revenue share | Standard UK affiliate contracts |
| Review-page effect at a rating below 3.7 | 60% look; one in four of them leaves | A conservative reading of published review research |
Mechanism 1: affiliate tax on your own players
Take a brand at the market median: 10% of the first page, not at position #1, review platforms at #2 and #3 and one affiliate at #4. Of 10,000 branded searches a month, about 600 clicks go to the affiliate at #4. Half of those players come back to the brand through the affiliate's tracking link; 15% of them deposit. That is 45 first deposits a month attributed to the affiliate, from players who typed your name. At £250 each: £11,250 a month, £135,000 a year paid for players you already had. On revenue share it gets worse over time: 30% of everything those 45 players ever lose.
Across the category the range runs from zero (21% of first pages have no affiliates at all) to £20,000-£30,000 a month for brands where affiliates hold two or three positions. 79% of operators have at least one affiliate on their first page.
Mechanism 2: the review-page tax on paid acquisition
Review platforms hold 30% of the first page, and the player reading them is at the point of decision. Published review research agrees on the shape of the effect: below four stars the share of consumers willing to proceed drops sharply, and the best-known academic estimate (Michael Luca, Harvard Business School) links a one-star difference to a 5-9% difference in revenue. Applied conservatively to a brand rated below 3.7, which is 82% of the category: 60% of branded-intent visitors look at the review page and one in four of them leaves, a 15% loss of branded-search conversion. On 10,000 searches at 15% conversion that is 225 lost first deposits a month.
In a media buyer's language: most paid funnels end with the player searching for the brand before depositing, so the review page taxes the last step of every Facebook and Google campaign: every £100,000 of paid budget has to become £118,000 to deliver the same number of deposits. The cost of a first deposit did not change on the platform; it changed on Trustpilot.
Mechanism 3: replies, rating and the players who stay
In this data, brands answering at least half of their reviews carry a negative share of 44-54%; brands that never answer carry 62% at an average rating of 1.94. An independent hotel study (Proserpio and Zervas, Marketing Science) found that hotels that started responding to reviews raised their rating by about 0.12 stars and received 12% more reviews. A reply changes what future customers will write, not only how past ones are read. For an operator the retention conclusion is direct: an unanswered withdrawal complaint is read by every player deciding whether to make a second deposit. And 63% of operators had no new review in 30 days: their profile is a fossil of the last unhappy player, and it greets everyone who comes back.
The bill for the median brand
| Line | Per month | Per year | Basis |
|---|---|---|---|
| Affiliate tax on branded-intent players | £11,250 | £135,000 | 45 FTDs at £250 CPA |
| First deposits lost on the review page | 225 FTDs | 2,700 FTDs | 15% of branded-search conversion |
| Equivalent paid budget to replace them | £56,000 | £675,000 | 225 FTDs at £250 |
| Rise in effective CPA in paid channels | +18% | +18% | 1 / (1 minus 15%) |
Illustrative: all assumptions are stated above, and every line scales with branded-search volume. A brand with 2,000 branded searches a month divides the figures by five; a brand with 50,000 multiplies them by five. The mechanisms do not change.
Calculate it for your brand
The model from section 7: each affiliate at positions #4-#6 gets 6% of clicks, half of the players come back through its link, 15% deposit. At a rating below 3.7 the review page takes 15% of branded-search conversion. The figures are illustrative; substitute your own.
8. Reachability: who you can actually talk to
A finding for the other side of the table: agencies, affiliates, suppliers. For each operator we tried to find, in public sources only, a named person and an email address, verifying every source.
For 23% of operators a named person can be found and confirmed in public sources; for 19.5% that person is a decision-maker. Some kind of business address exists for 63%, but a personal mailbox for only 4%. The remaining fifty-nine points of reachability are support@ and info@.
Small business is the most transparent layer: a decision-maker can be found for 33%, a personal mailbox for 6%, and a business email exists for 79%. Enterprise is the most closed: a person can be found for only 13%, a personal mailbox for 1.5%. Micro-operators, the bulk of the category, publish people in 16% of cases, and for most of them the only door is the support mailbox.
The practical conclusion for everyone selling to this market: a decision-maker can be found in roughly one case in five and reached directly in roughly one in twenty-five. Everything else goes through support, so the quality of the first email matters far more here than in most B2B categories.
The only section not computed on the whole category: contact search was run on 1,224 operators, and paid people search was budget-limited. Read these shares as a lower bound of reachability, not its exact value.
9. What good looks like
Twelve operators in the category hold a Trustpilot rating of 4.0 or higher with at least 50 reviews and answer no less than half of their reviews. That is 0.9% of the category. They are named because every figure is public and verifiable, and because together they show which bar is the hardest.
| Brand | Rating | Reviews | Own share of the first page | Replies to reviews |
|---|---|---|---|---|
| Lottomart | 4.5 | 12,332 | 38% | 100% |
| Stakemate | 4.5 | 2,519 | 33% | 91% |
| tombola Arcade | 4.4 | 10,784 | 30% | 100% |
| Slots Temple | 4.4 | 2,518 | 17% | 99% |
| BETDAQ | 4.4 | 1,635 | 11% | 93% |
| Spreadex Sports | 4.4 | 2,256 | 0% | 74% |
| Bingostars | 4.3 | 148 | 20% | 100% |
| Hollywoodbets UK | 4.3 | 1,626 | 11% | 100% |
| Happytiger | 4.1 | 3,393 | 40% | 100% |
| NetBet.co.uk | 4.1 | 2,908 | 13% | 99% |
| Butlers Bingo | 4.0 | 1,495 | 44% | 100% |
| Rosy Bingo | 4.0 | 1,165 | 40% | 100% |
Outside the table: Jemlit, 4.1 on 776 reviews with 95% replies, clears every bar. But it is a mystery-box platform (listed on Trustpilot under Gambling Service), not a casino or a bookmaker, so we do not count it as an operator in the sense of this report.
Eleven of the twelve answer nine reviews in ten or more, and each holds a rating the category almost never reaches, most of them on thousands of reviews rather than dozens. What none of them has is the search page: the best result is 44% at Butlers Bingo. Spreadex Sports has an own share of 0% by our classification even though spreadex.com itself sits at position #1: the brand is named "Spreadex Sports" in the data, the domain is named differently, and the classifier did not count the pair as the brand's own. A telling failure: when brand name and domain diverge, both algorithms and players lose track. The review bar is cleared by discipline, and they cleared it. The search bar is the next step, and it is the same for all twelve.
A scorecard for your brand
Five measures, each checkable in under ten minutes, with the market median and the level the best reach.
| Measure | Market median | Top group | How to check |
|---|---|---|---|
| Own share of the branded first page | 10% | 51%+ for 2.2% of the category | Type the brand name in a private window; count the ten results |
| Brand holds position #1 | no (9.1%) | yes | Same query: is the first result yours? |
| Share of reviews answered | 0% | 90%+ (this group averages 3.12) | Trustpilot profile: count the replies on the last twenty reviews |
| Profile claimed | yes (60.3% of the category) | yes | Trustpilot: is the "claimed" badge there? |
| Relevant Reddit threads | 0 | 0 | Search the brand name on reddit.com; open every thread |
10. Where to start
In descending order of return on effort. The first two items cost nothing but discipline, and in this data they are exactly what separates the brands players trust from the rest.
- 1
Answer every negative review within 48 hours, publicly and on the merits. 60% of operators have already claimed the profile: the permission is there, the habit is notno budget
- 2
Make branded-search conversion a KPI: branded organic visit to first deposit, monthlyno budget
- 3
Check affiliate positions on your branded first page; add branded-query and brand-SEO clauses to affiliate contracts
- 4
Occupy the first page: site, app pages, social profiles and two satellite pages of your own, target 40% of the page
- 5
Replace keyword community monitoring with a monthly check of the threads where the brand is actually named
A note on sequence. The affiliate audit (3) and first-page work (4) pay back faster when the review profile is already answered (1): a player who reached your page and then read an unanswered complaint was won twice and lost once. How first-page work is built and what to do about hostile results is described in our SERM and Trustpilot management services, and the overall approach to an operator's reputation in casino website promotion: SEO where it is hard.
Questions and answers
What people ask most often about the study and how to apply it to their own brand.
Does the study apply to markets outside the United Kingdom?
The figures are British, the mechanics are universal. In any market a player googles the brand before depositing, review platforms and affiliates compete for the first page, and an unanswered review reads as a pattern. Shares and prices change (CPA, affiliate terms, the role of Trustpilot versus local platforms), but the five-measure scorecard and the sequence of actions in section 10 work everywhere. Plug your own numbers into the calculator in section 7.
Why is the first page for the brand name more important than the rating?
Because it is everyone's pain, not only the damaged brands'. Among the 68 brands rated 4.0+, 39 have search results as their main problem, and reviews did not become the main pain for any of them. And a good rating does not buy search results: brands rated 4.0+ control 12.3% of their first page against 14.2% for the rest. The rating decides what a player thinks once they reach the review page; the first page decides whether they reach you at all, and through whose link.
How much does it cost to claim a Trustpilot profile, and what does it give you?
Nothing: it is free and takes minutes. But claiming by itself changes nothing: claimed profiles average 2.04, unclaimed 2.09. Claiming only unlocks the right to reply, and it is replies that split the category in two: 1.94 and 62% negative for the silent against 3.12 and 44% for those answering nine reviews in ten. 60.3% of UK operators have claimed the profile; only about 13% ever reply.
How do I calculate the affiliate tax for my brand?
Type the brand name in a private window and count the affiliates on the first page: 79% of operators have at least one. Each one at positions #4-#6 gets about 6% of branded clicks; half of the players come back to you through its tracking link, 15% of them deposit, and you pay CPA for each. At 10,000 searches and one affiliate that is 45 first deposits and £11,250 a month. The calculator in section 7 runs it on your numbers.
Do I need Reddit monitoring if there is almost no real negativity there?
You need a check, not keyword monitoring. Tools show 26% of operators as "discussed", but once you require the thread to actually be about the brand, 8.7% remain, and negative threads exist for 0.5%. A monthly hour of manually checking threads with the brand name in the URL gives the same picture without two-thirds of the noise. The exception is brands with a unique name: for them keyword search does not lie.
Where can I get the full report?
The full version with the appendix and data tables is available on request: leave a request or write to hello@buylink.pro. New findings and short data notes are published on our LinkedIn page.